
Installing solar panels on a typical American home costs $17,500 to $24,500 before incentives, or about $2.50 to $3.50 per watt for a standard 7 kW system. After applying the 30% federal tax credit, most homeowners pay between $12,250 and $17,150 out of pocket. These numbers represent your starting point, but the real question isn’t what solar costs. It’s how much you’ll save over the life of your system.
Your savings depend on three critical variables: your current electricity rates, how much sunlight your roof receives, and the incentives available in your state. A homeowner in Massachusetts paying high electricity rates might recoup their investment in six to eight years, while someone in a low-rate state could wait twelve years or more. Geography plays a dual role here. Arizona and Texas offer some of the lowest installation costs at $2.16 to $2.24 per watt, while Massachusetts and New York run significantly higher at $3.18 to $3.35 per watt.
Most residential systems generate enough electricity to offset 70% to 100% of a household’s power consumption, translating to decades of reduced or eliminated utility bills. With panels typically warranted for 25 years and lasting 30 or more, the math shifts from “Can I afford solar?” to “Can I afford not to invest?” as renewable energy trends continue driving down equipment costs while utility rates climb.
This article breaks down exactly how to calculate your personal savings potential, accounting for system size, local electricity costs, available incentives, and whether professional installation or a DIY approach makes financial sense for your situation.
Understanding Your Solar Savings Potential
Solar panels create savings by transforming sunlight into electricity you use instead of buying from the grid. Every kilowatt-hour your system produces reduces the amount you purchase at retail rates, which means direct bill reduction month after month. A typical household might consume 900 kWh monthly; if your solar array generates 800 kWh, you’re only paying for the remaining 100 kWh.
The size of your system determines how much electricity you produce. A 7 kW installation in a sunny location might generate 9,000-11,000 kWh annually, while the same system in a cloudier climate produces 7,000-8,000 kWh. Understanding how solar works helps you match system capacity to your actual consumption patterns rather than over- or under-sizing your array.
Net metering amplifies savings by crediting you for surplus generation. On sunny weekends when you’re away, your panels may produce more than you need; that excess flows back to the grid, and the utility credits your account at or near retail rates. You draw from those credits during evenings or cloudy days, effectively using the grid as a battery. Policies vary by state, but net metering turns your system into a two-way financial relationship rather than a one-direction expense.
Long-term protection matters because electricity rates climb over time. The average American residential rate has increased roughly 2-3% annually over the past decade. Once you install solar, most of your energy is self-generated at zero marginal cost, insulating you from future rate hikes. Over a 25-year system lifespan, that protection compounds into substantial savings beyond the immediate bill reduction.
What You’ll Pay: Solar Panel Installation Costs in 2026
Regional Price Variations
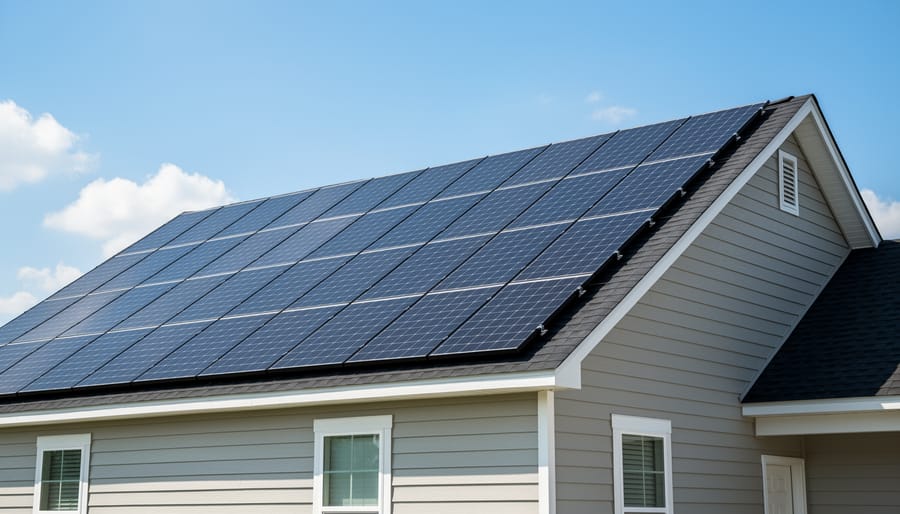
While national averages help establish baseline expectations, solar panel costs vary dramatically by state. Arizona and Texas homeowners enjoy some of the country’s lowest installation rates at $2.16, $2.24 per watt, making a 7 kW system cost roughly $15,120, $15,680 before incentives. On the opposite end, Massachusetts and New York residents face $3.18, $3.35 per watt, pushing that same 7 kW system to $22,260, $23,450.
These regional differences stem from several concrete factors. Labor costs account for much of the spread, installing panels in high cost-of-living areas means paying skilled electricians and roofers proportionally higher wages. Permitting fees and inspection requirements also vary widely; some municipalities charge hundreds more than others, and complex approval processes add indirect costs through project delays.
Market competition plays a significant role, too. States with mature solar markets and dozens of installers competing for business tend to offer lower per-watt pricing than regions where only a handful of companies operate. Shipping and logistics expenses increase in remote areas, while sunnier states often see higher installer density and more aggressive pricing.
According to 2026 residential solar pricing data, these regional gaps can translate to $7,000+ differences in upfront investment for identical system sizes, directly affecting your payback timeline and overall savings potential.
Where Your Money Goes: Solar System Cost Breakdown
Understanding where your installation dollars actually go helps you evaluate quotes and spot inflated pricing. When you review real installation pricing the total reflects multiple components beyond just the panels themselves.
For a typical residential system priced at $2.75 per watt, around $19,250 for a 7 kW installation before incentives, the cost distribution looks like this:
- Solar panels: 25-30% of total cost
- Inverters: 10-15%
- Mounting hardware and racking: 5-10%
- Labor and installation: 15-20%
- Permitting, inspection fees, and interconnection: 5-10%
- Installer margin and overhead: 15-20%
- Battery storage (if included): 30-40% additional
Equipment accounts for roughly half of your total expense. The panels themselves represent the largest single hardware cost, though premium efficiency models can push this percentage higher. Inverters, which convert DC electricity to usable AC power, vary significantly in price between string inverters and microinverter systems.
Labor costs cover design, engineering, installation crews, and project management. This percentage stays relatively consistent across regions, though higher local wages in states like Massachusetts and New York contribute to their $3.18-$3.35 per watt pricing versus Arizona’s $2.16.
Permitting and inspection fees, often overlooked, include building permits, electrical permits, utility interconnection applications, and required inspections. These soft costs add $1,000-$2,000 to most residential projects.
The installer’s margin covers business overhead, insurance, warranties, and profit. Larger national installers typically charge 18-20% markup, while local contractors may run 15-17%.
Battery storage dramatically changes the equation. Adding a 10 kWh battery to a 7 kW system increases total cost by $7,000-$10,000, shifting the overall budget and extending payback periods by several years.
What Changes the Price: Factors That Affect Your Solar Costs
Your final solar costs depend on a complex mix of physical, geographic, and technical variables, some within your control, others determined by where you live and the characteristics of your property.
Roof condition and complexity significantly impact installation expenses. Older roofs may require reinforcement or replacement before panels can be safely mounted, adding $5,000, $15,000 to the project. Multi-level roofs with steep pitches, dormers, or unusual angles increase labor time and equipment needs. A simple single-story ranch costs substantially less to outfit than a two-story Victorian with multiple roof planes.
Shading and sun exposure directly affect both installation cost and long-term savings potential. Trees, chimneys, or neighboring buildings that cast shadows force installers to use optimizers or microinverters rather than standard string inverters, raising equipment costs by $0.30, $0.50 per watt. More critically, heavy shading reduces energy production, a system generating 20% less electricity because of shade delivers 20% smaller savings over its lifetime.
System size follows economies of scale. While a 12 kW installation averages $31,135 before incentives, the per-watt cost often drops compared to smaller systems because fixed expenses like permitting, design, and mobilization are spread across more panels. Conversely, unusually small systems face higher per-watt pricing.
Equipment quality creates a wide price spectrum. Budget-tier panels and inverters might save 15-25% upfront but typically carry shorter warranties and lower efficiency ratings. Premium equipment with 25-year performance guarantees and higher degradation resistance costs more initially but protects long-term savings by maintaining output levels as the system ages.
Location and permitting drive regional price differences beyond just sunlight hours. Arizona and Texas average $2.16, $2.24 per watt partly because streamlined permitting and competitive installer markets keep soft costs low. Massachusetts and New York run $3.18, $3.35 per watt, reflecting stricter building codes, higher labor rates, and more complex interconnection requirements. Annual sunlight hours matter too, a system in Phoenix produces roughly 40% more electricity than an identical setup in Seattle, dramatically improving savings potential despite similar installation costs.
Incentives and Tax Credits That Reduce Your Out-of-Pocket Cost
How the Federal Tax Credit Works
The federal Investment Tax Credit (ITC) lets you claim 30% of your total solar installation cost as a credit against your federal income taxes. Unlike a deduction, which only reduces your taxable income, this credit directly reduces what you owe the IRS dollar-for-dollar.
Here’s how it works in practice. If you install a 7 kW system costing $17,500, you multiply that amount by 0.30 to get your credit: $5,250. You claim this when you file your taxes for the year your system becomes operational. The credit reduces your tax liability, and if it exceeds what you owe for that year, you can roll the remaining credit forward to future tax years, there’s no expiration on how long you can carry it.
Your eligibility hinges on owning the system outright. If you lease panels or sign a power purchase agreement, the installation company claims the credit, not you. You also need sufficient tax liability to use the credit. Someone who owes $3,000 in federal taxes but gets a $5,250 credit will apply $3,000 immediately and carry $2,250 forward.
Looking at real numbers, a system in the $17,500, $24,500 range drops to $12,250, $17,150 after the credit. That $7,350 reduction on the high end changes the economics significantly. A 12 kW commercial or large residential system costing $31,135 falls to $21,795 after the 30% credit, a $9,340 savings that shortens your payback period by years.
Calculating Your Annual and Lifetime Savings
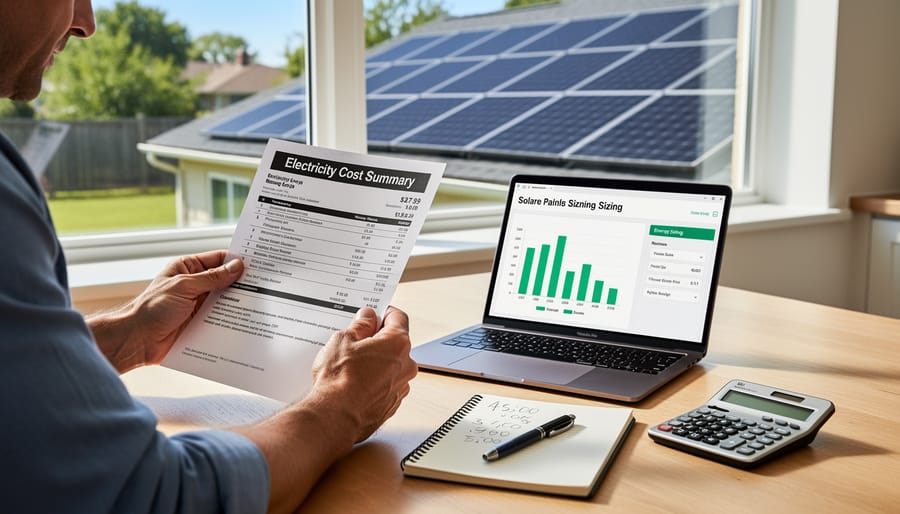
Pinning down your solar savings requires more math than guesswork, but the framework is straightforward once you have three numbers: your annual electricity consumption, your local rate per kilowatt-hour, and your system’s expected production. Start by gathering twelve months of utility bills to find your total annual usage in kWh. A household using 10,000 kWh per year at $0.13 per kWh currently pays $1,300 annually for electricity. If a 7 kW system generates 9,000 kWh in your climate, offsetting 90% of consumption, your annual savings would be roughly $1,170.
The calculation follows a logical sequence:
- Determine your annual electricity consumption by adding up the kWh totals from a full year of utility bills
- Calculate your system’s production potential by multiplying installed capacity by your region’s average sun hours and a 0.75-0.85 efficiency factor
- Multiply the percentage of consumption your system offsets by your current annual electricity costs to find first-year savings
- Factor in electricity rate escalation, historically 2-3% annually, to project rising savings in future years
- Sum the adjusted annual savings over 25 years to arrive at lifetime savings, accounting for gradual panel degradation of roughly 0.5% per year
Payback period divides your net system cost by annual savings. Using the earlier example, a 7 kW system costing $13,475 after the 30% federal tax credit with $1,170 in year-one savings yields an 11.5-year payback. That same system producing for 25 years at escalating electricity rates could deliver $35,000, $50,000 in total savings, depending on how aggressively rates climb.
Location dramatically shifts these numbers. A 7 kW array in sun-drenched Arizona might produce 11,000 kWh annually, while the same system in cloudier Massachusetts generates closer to 8,500 kWh. But Massachusetts residents often pay $0.22, $0.28 per kWh versus Arizona’s $0.12, $0.14, which narrows the savings gap. Run the calculation with your specific consumption, local rates, and realistic production estimates rather than national averages to see what your household will actually save.
DIY Solar vs. Professional Installation: Cost and Savings Trade-offs
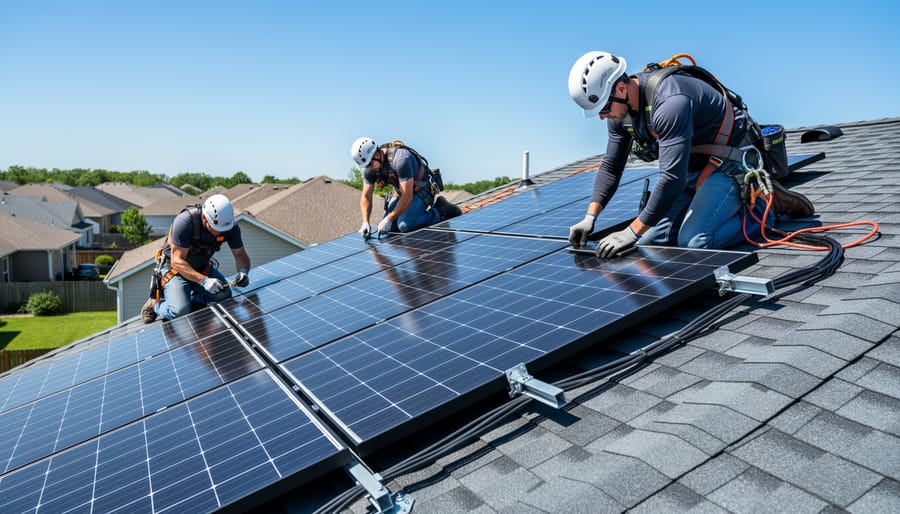
DIY solar kits promise dramatic cost savings, typically running 40-60% less than professional installation. A 7 kW system that costs $17,500, $24,500 installed might only require $7,000, $10,000 in equipment if you handle the installation yourself. For handy homeowners comfortable working on roofs and with electrical systems, this upfront difference is tempting.
The trade-off comes in what you give up. DIY installations shift all responsibility for design accuracy, structural integrity, electrical safety, and code compliance onto you. Most manufacturers void equipment warranties if panels aren’t installed by certified professionals, and some local jurisdictions won’t issue permits for owner-installed systems. More critically, the 30% federal tax credit requires the system to meet specific installation standards, and some utility net metering programs only accept professionally installed systems.
DIY Solar Pros
- Reduces upfront costs by 40-60%, potentially saving $10,000, $15,000 on a typical residential system.
- Gives you complete control over installation timeline and component selection.
- Allows you to learn the system thoroughly, which can help with future maintenance.
DIY Solar Cons
- Voids most manufacturer warranties and eliminates workmanship guarantees.
- Creates permitting and inspection hurdles that delay or prevent system approval.
- Carries electrical shock and fall risks without professional safety protocols.
- May disqualify you from certain incentives, net metering programs, or the federal tax credit if installation doesn’t meet requirements.
- Often results in suboptimal panel placement and wiring that reduces long-term energy production.
Professional installation costs more upfront but delivers faster permitting, proper utility interconnection, optimized system design for your roof and shading conditions, and full warranty protection. Installers also handle the paperwork for incentives and rebates, which speeds up the process and reduces the risk of disqualification. For most homeowners, the additional $10,000, $15,000 pays for expertise that ensures the system performs as expected for 25-plus years and qualifies for all available savings programs.
The break-even calculation shifts when you factor in these risks. A DIY system that costs $8,000 but produces 15% less energy due to poor placement, loses warranty coverage, and takes six extra months to permit may not save as much as a $20,000 professional installation that generates maximum output and qualifies for the full 30% tax credit immediately.
Real-World Savings Examples
Consider three households to see how location, system size, and usage translate into real dollar savings.
A family of four in Phoenix with a 7 kW system and monthly electricity bills averaging $180 installs panels at $2.20 per watt. After the 30% federal tax credit, they pay $10,780 out of pocket. Their system generates enough power to eliminate roughly 85% of their electricity costs, cutting monthly bills to $27. That’s $1,836 saved annually, with a payback period under six years. Over 25 years, they save approximately $45,900 before accounting for electricity rate increases.
In Massachusetts, a couple with higher usage averaging $220 monthly installs an 8 kW system at $3.25 per watt. Post-tax credit, their net cost is $18,200. The system offsets about 90% of consumption, reducing their bill to $22 per month. Annual savings hit $2,376, and the payback stretches to roughly 7.7 years. Lifetime savings approach $59,400, boosted by New England’s higher electricity rates and strong net metering policies.
A retired homeowner in Texas with modest usage of $110 monthly chooses a smaller 5 kW system at $2.24 per watt. After incentives, the investment is $7,840. Covering 80% of their needs drops the bill to $22 monthly. They save $1,056 annually with a payback just over seven years, accumulating $26,400 in savings over the system’s lifespan.
These examples reflect typical scenarios using verified 2026 pricing, though individual results vary based on shading, roof orientation, and the latest solar technology selected. Homes with higher baseline consumption and strong sun exposure see the fastest returns.
Expert Insights on Maximizing Solar Savings
Industry professionals emphasize that optimizing solar savings starts before installation. “The biggest mistake homeowners make is either oversizing or undersizing their system,” explains Marcus Chen, a certified solar installer with 12 years of experience. “Pull two years of electricity bills and calculate your average daily usage. Your system should offset 90-100% of that, not what you hope to use someday.” Chen notes that oversizing by more than 10% means paying upfront for capacity you won’t use, while undersizing leaves money on the table in ongoing utility costs.
Equipment selection directly impacts long-term returns. Sarah Mitchell, an energy consultant who’s evaluated over 500 residential installations, recommends balancing efficiency against budget. “Premium panels with 22% efficiency versus standard 19% panels might cost $2,000-3,000 more on a 7 kW system, but they produce 15-18% more electricity over 25 years. That’s where you see the real payback.” She cautions against the cheapest equipment, pointing to warranty coverage as a key factor, manufacturers offering 25-year performance guarantees versus 10-year coverage signal quality differences that affect lifetime savings.
Financing choices alter the savings equation substantially. Mitchell suggests that homeowners with available capital should pay cash or take the 30% federal tax credit as a lump sum rather than financing. “A solar loan at 6-8% interest can add $8,000-12,000 to the total cost of a typical system, essentially erasing three to four years of electricity savings.” For those who must finance, she recommends the shortest term possible to minimize interest burden while maintaining manageable payments.
Frequently Asked Questions About Solar Savings
How long until solar panels pay for themselves?
Most residential solar systems pay for themselves in 6 to 10 years through electricity bill savings, depending on your location, system size, and local electricity rates. After the payback period, you’ll enjoy 15 to 20 more years of essentially free electricity from your system.
Do solar panels work in cloudy climates?
Yes, solar panels generate electricity even on overcast days, though at reduced efficiency compared to direct sunlight. States like Massachusetts and New York see strong solar adoption despite cloudier weather because annual production still delivers significant savings, and higher electricity rates offset lower sun exposure.
What happens to my savings if I move?
Solar panels typically increase your home’s resale value by an amount close to or exceeding the system cost, allowing you to recoup your investment. Alternatively, some financing agreements let you transfer the system and payments to the new homeowner, though this may complicate the sale.
How do electricity rate increases affect my savings?
Rising electricity rates amplify your solar savings over time since you’re shielded from utility price hikes. A system that saves you $1,200 annually today could save $1,800 or more per year a decade from now if rates climb 3 to 5 percent annually, which accelerates your return on investment.
Beyond these common concerns, maintenance costs remain minimal throughout your system’s lifespan. You’ll spend little to nothing on upkeep since panels have no moving parts and warranties cover equipment failures for 20 to 25 years. Occasional cleaning to remove debris might cost $100 to $300 if you hire a service, though rain handles most of this naturally. Inverter replacement represents the only significant expense, typically running $1,500 to $3,000 after 10 to 15 years, but this single cost barely dents your cumulative savings.
Financing choices also shape your savings timeline and total return. Cash purchases deliver the fastest payback and highest lifetime savings since you avoid interest charges. Loans extend the payback period by a few years due to interest but still provide positive cash flow once you’ve paid off the principal. Leases and power purchase agreements eliminate upfront costs but cap your total savings since you don’t own the system or claim the federal tax credit.
Your savings potential hinges on these variables working together. A homeowner in Arizona paying $2.16 per watt with high electricity rates and abundant sunshine will see faster returns than someone in a cloudier, lower-cost state. Get quotes specific to your property, usage patterns, and local incentives to calculate your personalized savings rather than relying on national averages.
Your potential savings with solar panels depend on four interconnected factors: what you pay upfront after incentives, your local electricity rates, how well your system performs, and the long-term protection against rising energy costs. A typical 7 kW residential system costs $17,500, $24,500 before the federal tax credit, dropping to $12,250, $17,150 after claiming the 30% ITC. From there, your savings accumulate through reduced monthly bills, net metering credits, and insulation from utility rate increases that typically outpace inflation.
Most homeowners break even within six to ten years, then enjoy free electricity for the remaining lifespan of their panels. A system producing 10,000 kWh annually in a state with $0.15 per kWh rates saves $1,500 every year, compounding to substantial savings over two decades. Regional variations matter: states with high electricity costs and strong sun exposure deliver faster payback periods, while areas with cheaper grid power or frequent cloud cover extend the timeline.
The clearest path forward is getting personalized quotes from local installers who can assess your roof, calculate your specific usage patterns, and factor in state-level incentives beyond the federal credit. Generic estimates provide direction, but your actual savings depend on variables unique to your property and energy consumption. Request multiple bids, compare equipment warranties, and verify each installer’s calculations against your recent utility bills to build an accurate financial picture.