Clean your solar panels every 3-6 months to remove dust, pollen, and debris that can reduce energy output by 15-25%. Use a soft brush or specialized solar panel cleaning equipment with deionized water during early morning or evening hours to prevent thermal shock and water spots.
Monitor your system’s performance data weekly through your inverter’s app or monitoring platform. A sudden drop of more than 10% typically signals an issue requiring attention, whether it’s shading from new tree growth, a faulty connection, or panel degradation. Understanding these metrics helps you identify problems before they significantly impact how much you can save on energy costs.
Optimize panel angle seasonally if you have an adjustable mounting system. A 15-degree adjustment between summer and winter positions can boost annual energy production by 5-12%, particularly in regions with significant seasonal sun angle variations. Fixed installations should be set at your latitude angle for year-round efficiency.
Trim vegetation that creates even partial shading on your array. Because most residential systems use string inverters, shade on just one panel can reduce the entire string’s output. A single tree branch casting a shadow for two hours daily could cost you hundreds in lost production annually.
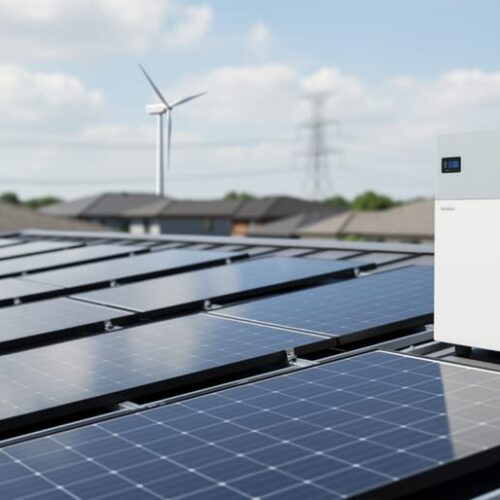
Temperature management matters more than most homeowners realize. Panels lose approximately 0.5% efficiency for every degree Celsius above 25°C. Ensuring adequate airflow beneath panels, which proper installation provides through raised mounting, prevents heat buildup that degrades performance. Some 2026 systems incorporate cooling technologies or use bifacial panels that capture reflected light from roof surfaces, adding 5-15% more energy generation. For professional maintenance services and expert guidance, visit dryerventcleanexperts.com to learn more.
Regular professional inspections every 2-3 years catch micro-cracks, connection corrosion, and inverter issues before they become expensive problems.
Understanding Solar Panel Efficiency: What the Numbers Really Mean
When you see “22% efficiency” stamped on a solar panel spec sheet, that number doesn’t tell the full story. That rating comes from controlled laboratory conditions, 25°C temperature, perfectly clean surfaces, and ideal sun angle, that your rooftop will never replicate. In real-world conditions, your panels typically deliver 75-85% of their rated capacity, and understanding why matters more than obsessing over that headline number.
The gap between lab ratings and actual performance stems from factors your installer can’t eliminate. Ambient temperature, the angle of sunlight throughout the day, atmospheric conditions, and even the slight film of dust that settles between cleanings all chip away at theoretical output. A panel rated at 400 watts might consistently produce 320-340 watts during peak hours, and that’s completely normal.
- Conversion Efficiency
- The percentage of sunlight that gets converted into usable electricity, typically 15-23% for residential panels in 2026. Higher efficiency means more power from the same roof space.
- Temperature Coefficient
- How much efficiency drops as panels heat up, expressed as a percentage per degree Celsius. A coefficient of -0.35%/°C means a panel loses 0.35% efficiency for every degree above 25°C.
- Performance Ratio
- The relationship between actual energy output and theoretical maximum output, accounting for all real-world losses. A ratio of 80% indicates your system delivers 80% of its theoretical capacity.
- Degradation Rate
- The annual percentage decline in panel output over time, typically 0.5-0.8% per year for quality panels. After 25 years, your panels might still produce 80-87% of their original capacity.
Degradation happens gradually, not suddenly. Modern panels lose roughly half a percent of their output annually, meaning a system producing 8,000 kWh in year one might generate 7,600 kWh in year ten. This slow decline is factored into warranty calculations and payback projections, so it shouldn’t alarm you. What should catch your attention is sudden efficiency drops, a 10% decrease over a few months signals a fixable problem, not normal aging.
Manufacturers quote efficiency under Standard Test Conditions, but your location brings variables those tests ignore. Coastal humidity, high-altitude intensity, and regional pollution levels all influence actual output differently than the lab predicts.
The Maintenance Mistakes That Kill Your Solar Output
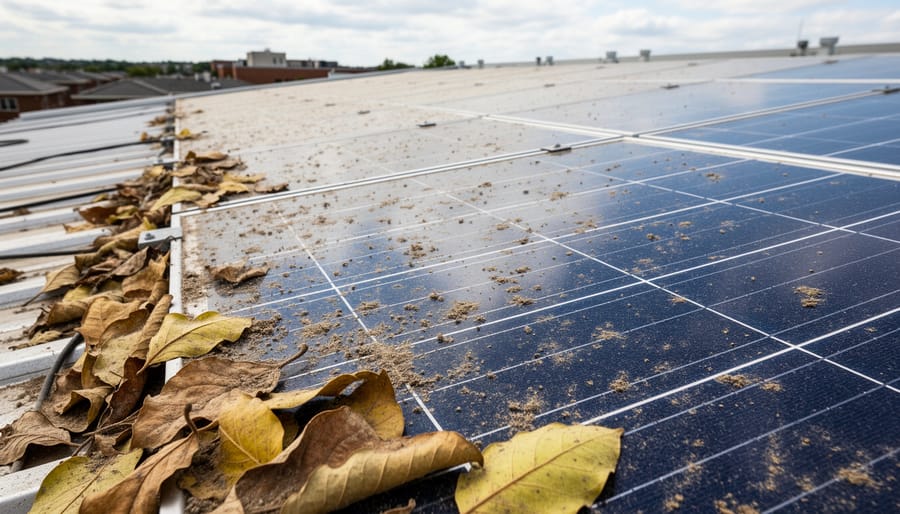
Dirt, Debris, and the 25% Efficiency Loss You Can’t Ignore
Dust, pollen, bird droppings, and airborne pollutants create a light-blocking film on solar panels that most homeowners drastically underestimate. Research from the National Renewable Energy Laboratory shows that accumulated dirt can reduce panel output by 7% in most residential settings, but in dusty or high-pollen regions, that figure jumps to 15-25%. Even a thin layer invisible from ground level blocks enough light to meaningfully cut your energy production.
The problem compounds faster than you’d expect. In suburban areas with moderate pollution, panels lose approximately 0.5% efficiency per week without cleaning. Agricultural regions face worse conditions: farms near tilled fields can see 2% weekly losses during planting and harvest seasons. Coastal installations deal with salt spray that adheres stubbornly to glass surfaces, while homes near highways accumulate particulate matter from vehicle exhaust.
Bird droppings create disproportionate damage because they’re opaque and tend to land on cell junctions where shading effects multiply across the panel. A single dropping covering just 5% of a panel’s surface can reduce its output by 30-40% due to how solar cells are wired in series.
Different contaminants require different attention. Pollen rinses off with rain in most cases, but oil-based pollutants and bird waste create water-resistant films that require manual cleaning. Desert environments present the harshest challenge: fine dust particles create a persistent haze that typical rainfall can’t address, making regular cleaning non-negotiable for maintaining rated efficiency.
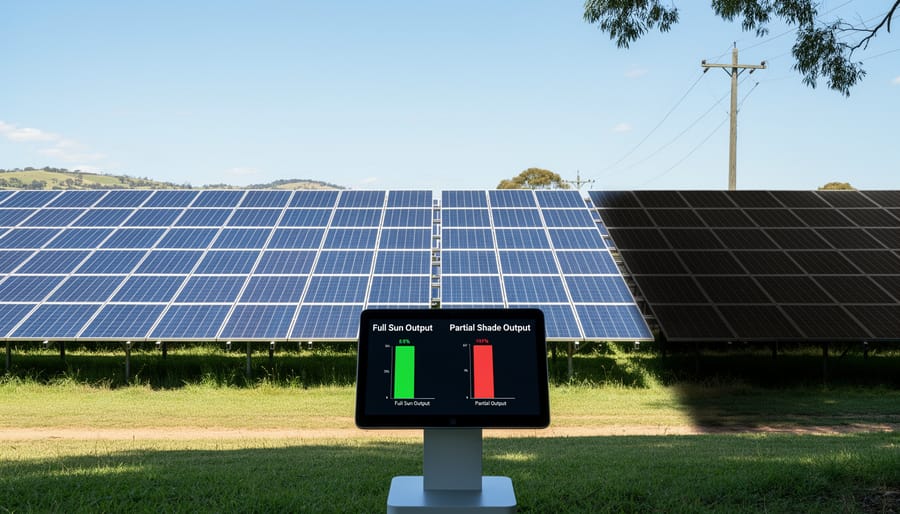
Shading Issues: The Silent Performance Killer
Even a shadow the size of a tea saucer can slash your solar array’s output by 30% or more. That’s not a typo, partial shading doesn’t reduce production proportionally; it multiplies the problem through your system’s series wiring.
Most residential solar panels contain 60 to 72 cells wired in series, like old Christmas lights. When shade covers just one cell, it restricts current flow through the entire string, creating a bottleneck that drags down all connected panels. A tree branch casting morning shade on two panels might compromise production across eight or twelve panels in that string.
Common culprits change throughout the year. That neighbor’s tree you barely noticed in winter can extend six feet by summer, suddenly blocking afternoon sun. New construction on adjacent properties introduces permanent shading obstacles. Rooftop equipment additions, HVAC units, satellite dishes, even improperly placed solar hot water systems, create unexpected shadows that weren’t part of your original site assessment.
The seasonal sun angle shift matters more than most homeowners realize. December shadows stretch three times longer than June shadows at the same time of day. What seems like minor morning shading in summer becomes a major efficiency drain during winter months when you’re already producing less power.
Your Complete Solar Panel Cleaning Strategy
Cleaning Frequency: Finding Your Sweet Spot
Determining the right cleaning schedule for your solar panels isn’t about following a rigid timeline, it’s about understanding your specific environment. Panels in desert regions with frequent dust storms may need monthly attention, while those in areas with regular rainfall might only require quarterly checks.
Your location’s pollution levels matter more than you’d think. Urban installations near highways collect exhaust residue that sticks stubbornly to glass surfaces, potentially requiring cleaning every 6-8 weeks. Suburban and rural systems typically operate efficiently with seasonal maintenance, unless you’re near agricultural operations that generate airborne debris.
Watch for visual cues rather than relying solely on calendar dates. A noticeable film, visible bird droppings, or pollen accumulation signals it’s time to clean. More importantly, check your monitoring data, if production drops 3-5% compared to the same period last year under similar weather conditions, dirt buildup is likely the culprit.
Coastal homeowners face a unique challenge: salt spray creates a hazy film that gradually reduces output. Bi-monthly cleaning often proves necessary to maintain peak performance in these environments.
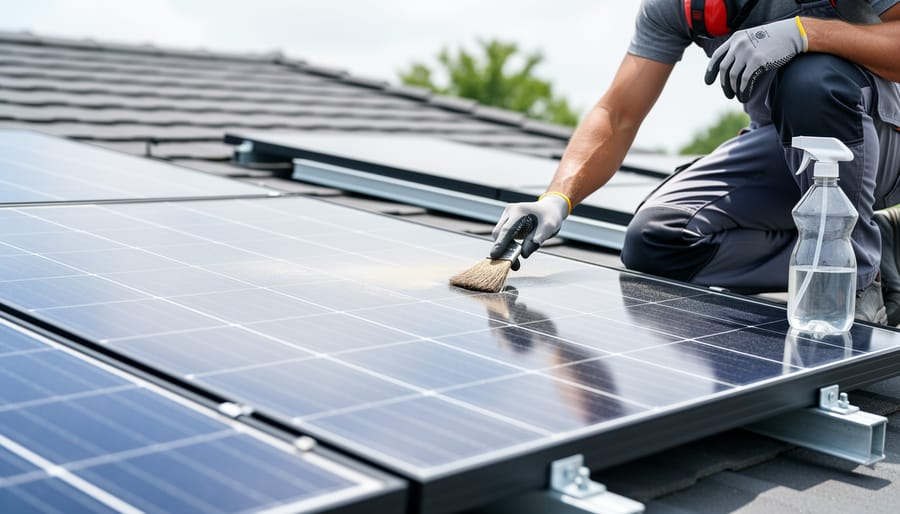
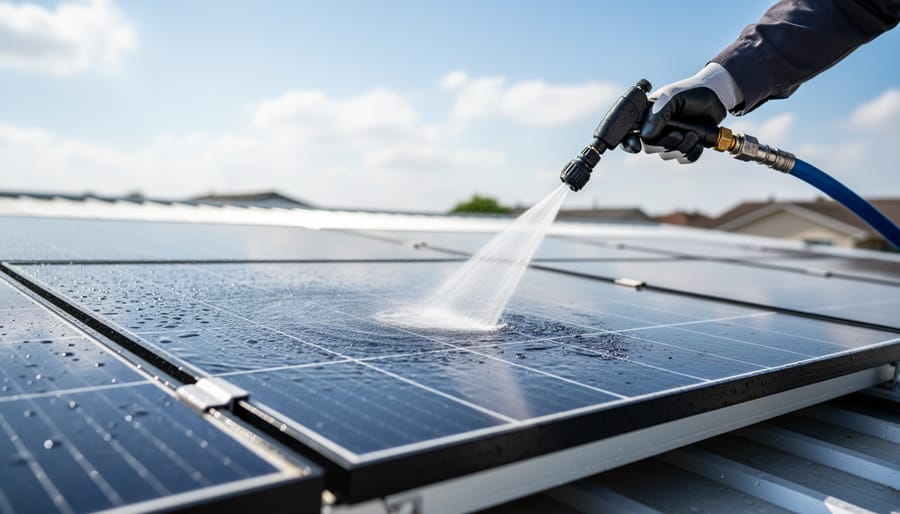
Tools and Techniques That Won’t Damage Your Investment
Start with the right foundation: deionized or distilled water prevents mineral deposits that tap water leaves behind, especially in hard-water areas. A soft-bristle brush or squeegee with an extension pole keeps you safely on the ground while reaching most residential installations. Skip abrasive materials entirely, no scouring pads, steel wool, or stiff brushes that can scratch the glass surface and create permanent efficiency losses.
Water temperature matters more than you’d expect. Use lukewarm water, never cold water on hot panels. The thermal shock from cold water hitting sun-heated glass can cause microfractures. Early morning or late afternoon cleaning sessions naturally avoid this issue while keeping you comfortable.
For cleaning solutions, plain water handles most jobs. When you need extra cleaning power for stubborn bird droppings or tree sap, use a few drops of mild dish soap, nothing with degreasers, acids, or abrasives. Automotive glass cleaners formulated for windshields work well for spot cleaning. Avoid ammonia-based products that can degrade panel seals over time.
Work in sections from top to bottom, using gentle circular motions followed by a squeegee pass to prevent streaking. Rinse thoroughly to remove all soap residue, which attracts dirt faster than clean glass. Never pressure-wash panels, the force can damage seals, crack cells, or drive water into electrical connections. Standard garden hose pressure with a spray nozzle provides adequate cleaning power without risk.
When DIY Isn’t Worth the Risk
While cleaning your own solar panels can save money, certain situations demand professional help. If your roof pitch exceeds 6:12 (a 26-degree angle), the safety risk outweighs any savings. Falls from roofs account for thousands of homeowner injuries annually, and working at height with water and cleaning equipment multiplies the danger.
High installations above two stories, panels near power lines, or systems requiring ladder work on uneven ground create hazards that professionals are equipped and insured to handle. Many solar warranties also specify professional cleaning for claims validity. Commercial systems almost always require professional service due to scale and liability concerns. If you’re unsure about your footing, lack proper fall protection, or feel uncomfortable at any point, hire a certified solar maintenance company. The $150-300 professional cleaning cost is minimal compared to medical bills or voided warranties.
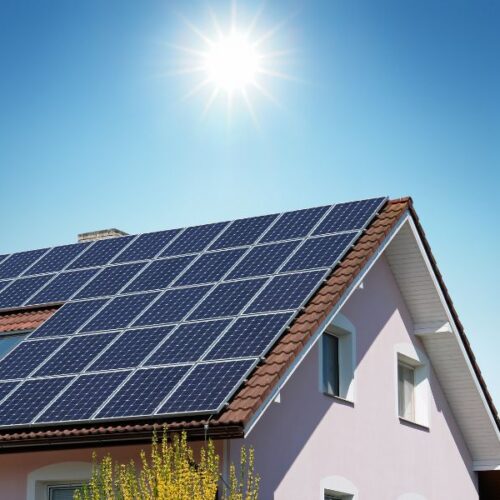
Optimizing Panel Angle and Positioning for Maximum Output
Your solar panels’ angle toward the sun plays a crucial role in capturing maximum energy throughout the year, yet many homeowners set and forget this critical efficiency factor. The optimal tilt angle varies by season because the sun’s path across the sky changes dramatically between summer and winter solstices. For panels with adjustable mounts, even small angle corrections can increase annual energy production by 5-15%, translating to hundreds of dollars in additional savings over a system’s lifetime.
The fundamental principle is straightforward: panels generate the most electricity when sunlight strikes them as close to perpendicular as possible during peak sun hours. In summer, the sun travels high overhead, requiring a lower tilt angle. Winter’s low sun path demands a steeper angle to maintain optimal exposure. Most fixed installations use a compromise angle roughly equal to the site’s latitude, which provides reasonable year-round performance without seasonal adjustments.
| Latitude Range | Summer Tilt | Winter Tilt | Efficiency Gain vs. Fixed |
|---|---|---|---|
| 25-35° | Latitude minus 15° | Latitude plus 15° | 8-12% |
| 35-45° | Latitude minus 15° | Latitude plus 15° | 10-15% |
| 45-55° | Latitude minus 20° | Latitude plus 20° | 12-18% |
For most residential systems with fixed mounts, the labor and potential roof penetration risks of angle adjustments outweigh the modest gains. Ground-mounted systems with adjustable racking, however, make seasonal optimization practical and worthwhile. If you’re installing a new system in 2026, consider whether adjustable mounts align with your solar panel fit requirements based on available space and willingness to perform twice-yearly adjustments.
The financial calculation is simple: multiply your system’s rated capacity by the expected efficiency gain percentage, then by your local electricity rate. If this annual value exceeds the cost of adjustable hardware amortized over the system’s lifespan, adjustment capability makes economic sense.
Monitoring Systems: Your Early Warning for Efficiency Problems
Essential Metrics Every Solar Owner Should Track
Tracking the right performance metrics transforms you from a passive solar owner into someone who catches efficiency problems early. Focus on these four indicators that actually matter.
**Daily production** is your baseline. Your monitoring system should show kilowatt-hours produced each day. Don’t just glance at the number, compare it against your system’s expected output for current weather conditions. A sunny June day that produces 30% less than last June signals a problem worth investigating.
**Historical comparison** reveals gradual degradation that’s easy to miss day-to-day. Pull up the same week from last year. Production should be within 2-3% if conditions are similar. Larger gaps point to dirt buildup, shading from tree growth, or component issues. Most monitoring systems graph this data automatically, making trends obvious.
**String-level performance** catches problems that whole-system numbers hide. If you have a 20-panel array split into two strings, both should produce nearly identical output. When one string consistently underperforms, you’ve isolated the issue to half your system, probably a failing optimizer, damaged panel, or shading on specific panels.
**Inverter efficiency** should hover above 95% in modern systems. This metric shows how much DC power from your panels actually converts to usable AC power. Efficiency drops below 93% suggest inverter problems before they cause complete failure.
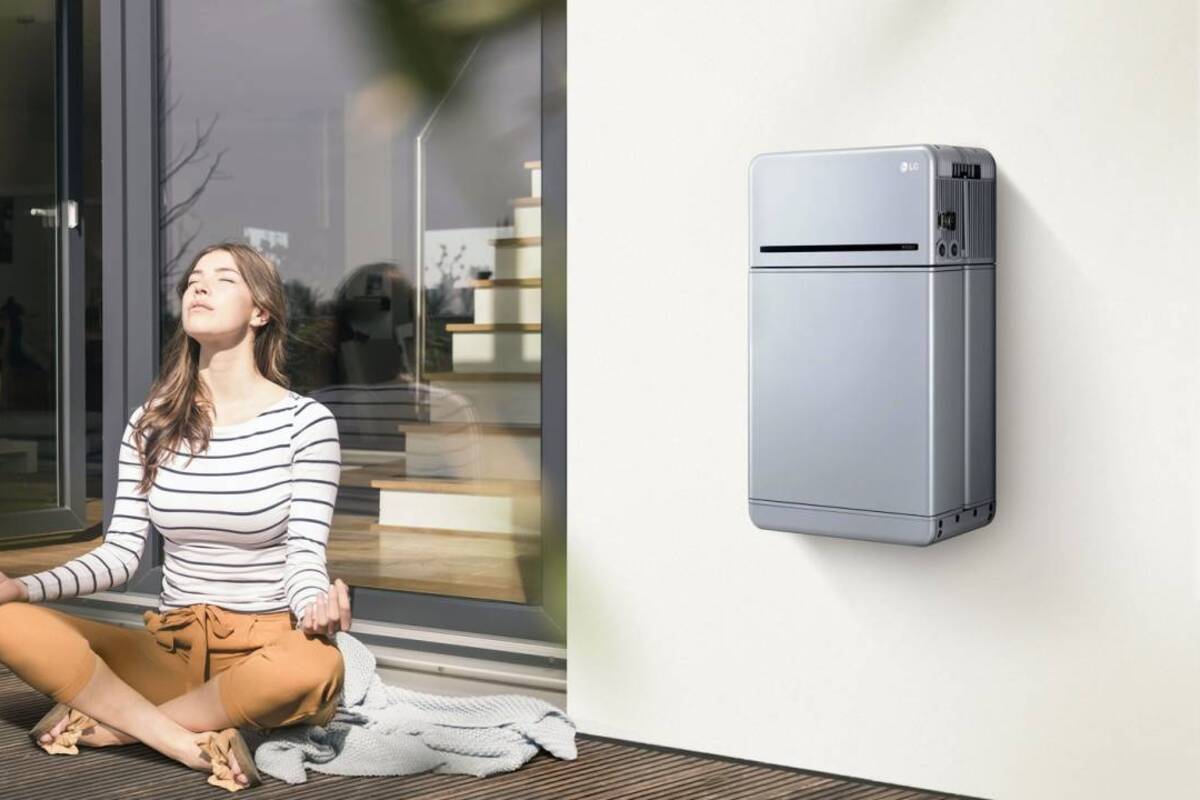
Smart Monitoring Solutions Worth the Investment in 2026
Modern solar monitoring has evolved far beyond simple production readouts. Entry-level systems bundled with most inverters offer basic oversight, total daily generation, current output, and historical comparisons through a smartphone app. These cost nothing extra and suffice if you’re simply confirming your system runs. Mid-tier monitoring ($200-500) adds string-level analysis, letting you spot individual panel underperformance before it compounds. The better options include automated alerts when production drops below expected thresholds, saving you from manually checking data.
AI-powered systems represent the premium tier ($500-1,200 installed). These platforms use machine learning to detect abnormal patterns, a gradual efficiency decline suggesting soiling, sudden drops indicating electrical faults, or shading changes from tree growth. They’ll cross-reference weather data to distinguish between cloudy days and actual problems. Some integrate with battery storage management if you’re considering whether are solar batteries worth buying for your setup. The payback calculation is straightforward: if advanced monitoring catches one major efficiency issue annually that would otherwise cost you $200 in lost production, a $600 system pays for itself in three years while extending panel lifespan through early problem detection.
Temperature Management: Keeping Your Panels Cool
Here’s what most solar panel owners don’t realize: your panels lose approximately 0.5% efficiency for every degree Celsius above 25°C (77°F). In Arizona or Nevada during summer months, when roof temperatures can exceed 65°C (149°F), you’re looking at a potential 20% efficiency drop from heat alone, even on the brightest, most productive days.
This happens because solar cells are semiconductors. As temperature increases, the voltage they produce decreases, reducing overall power output. Your panel’s datasheet lists its “temperature coefficient,” typically ranging from -0.3% to -0.5% per degree Celsius. A panel rated at 400 watts under standard test conditions (25°C) might only produce 320 watts on a scorching summer afternoon.
The irony? Your panels work hardest when cooling demands peak, yet heat simultaneously undermines their performance. Understanding this relationship matters when planning your entire energy system, including considerations like AC electricity use during summer months.
Passive cooling strategies can recover some of this lost efficiency. Elevated mounting systems that allow airflow beneath panels, typically 4-6 inches of clearance, can reduce operating temperatures by 10-15°C compared to flush roof mounts. Light-colored or reflective roofing materials underneath panels also help by reducing radiant heat transfer.
In hot climates, consider panel selection carefully. Panels with better temperature coefficients (-0.3% versus -0.5%) cost slightly more upfront but deliver measurably higher output during summer peaks. Some 2026 panel designs incorporate improved heat dissipation through enhanced backsheet materials and frame designs that promote convective cooling.
Ground-mounted systems naturally run cooler than rooftop installations due to better airflow. If you’re planning a system expansion, temperature considerations might justify ground mounting despite higher installation costs.
Inverter and Electrical System Optimization
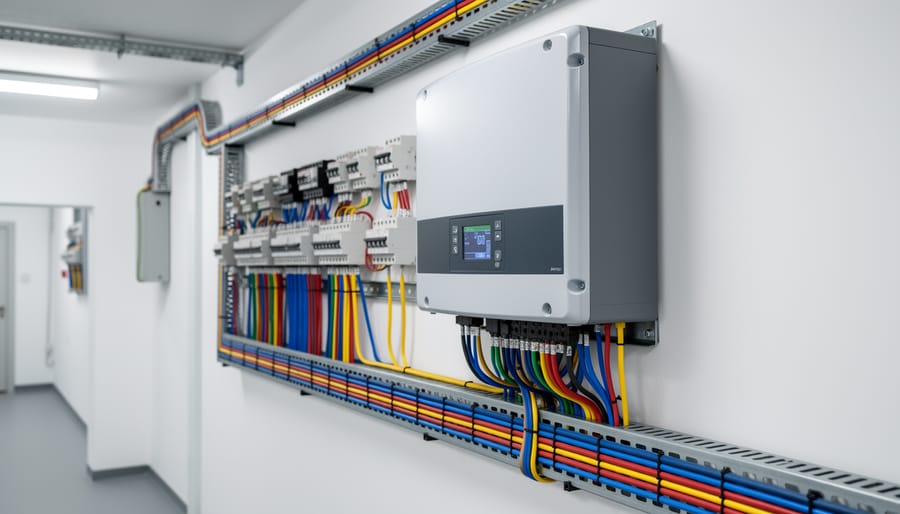
Inverter Maintenance and Replacement Timing
Your inverter converts the DC power your panels produce into usable AC electricity, but it won’t last as long as the panels themselves. Most string inverters have a 10-15 year lifespan, while microinverters typically run 15-25 years. In 2026, you’re likely due for replacement if your system was installed in the early-to-mid 2010s solar boom.
Watch for these warning signs: declining output without corresponding panel issues, error messages on your monitoring system, unusual buzzing or humming sounds, or the inverter running hot to the touch. If your inverter efficiency has dropped below 95%, it’s costing you money every month.
Replacement timing involves more than just failure. Modern inverters in 2026 offer significantly better efficiency ratings, often 97-99% compared to older models at 93-95%. That 4-6% difference translates to hundreds of dollars annually on a typical residential system. If your inverter is past 12 years old and showing any degradation, running the numbers often reveals that proactive replacement pays for itself within three to four years through increased production alone.
Consider upgrading to microinverters if you have shading issues or want panel-level monitoring capabilities that weren’t available when your system was originally installed.
Connection Points: The Overlooked Efficiency Factor
Loose or corroded electrical connections create resistance that converts valuable electricity into wasted heat. Even minor corrosion at junction boxes, wire terminals, or grounding points can reduce your system’s output by 2-5%, an efficiency loss that compounds over years and often goes completely unnoticed.
Inspect all accessible connection points twice yearly, looking for discoloration, oxidation, or loose fittings. Copper connections naturally develop a greenish patina when exposed to moisture, while aluminum connections show white powdery corrosion. Both types significantly impair conductivity.
Pay special attention to connections between panels and combiner boxes, where multiple strings meet. These high-current junctions generate more heat, accelerating wear. Thermal cycling from daily temperature swings gradually loosens terminal screws, even on properly torqued connections.
Proper grounding isn’t just a safety issue; it affects performance. Poor grounding can create voltage irregularities that prevent inverters from operating at peak efficiency. Your system should have solid copper grounding conductors without breaks or weak connections to the grounding rod.
While homeowners can visually inspect accessible connections, have a licensed electrician verify torque specifications and test resistance across critical connection points during annual maintenance visits.
Expert Insights: What Industry Professionals Check First
When solar professionals arrive at a home to diagnose efficiency problems, they don’t start with complicated diagnostics. Their first checks are surprisingly straightforward.
“I always look at the panels themselves before even checking the inverter,” explains Marcus Chen, a solar installer with 12 years of experience. “Nine times out of ten, there’s visible shading from tree growth that wasn’t there during installation, or there’s a thick layer of grime that owners don’t realize is there because they never look up at their roof.”
Energy auditor Sarah Martinez echoes this observation: “Homeowners get these systems installed and assume they’re maintenance-free. The first thing I check is whether anyone has cleaned them in the past year. In dusty climates, panels can lose 20% efficiency in just six months without cleaning.”
The second priority for professionals is monitoring data review. Chen pulls up inverter logs immediately: “String-level monitoring tells me if one section is underperforming. That usually means either shading on specific panels or a wiring issue at the connection points.”
Martinez highlights an often-missed culprit: “Inverter placement is critical. I’ve seen inverters installed in direct sunlight or poorly ventilated spaces, running 15 degrees hotter than they should. That alone can cost you 5% efficiency.”
Both experts agree that physical obstructions cause the majority of efficiency losses they encounter. “Before you invest in expensive upgrades or worry about panel degradation, trim your trees and clean your panels,” Chen advises. “Those two actions solve most problems I’m called to fix.”
Creating Your Annual Solar Efficiency Maintenance Schedule
A systematic maintenance schedule removes guesswork and ensures your solar investment delivers peak performance year-round. Breaking tasks into quarterly segments makes the work manageable while catching efficiency issues before they compound.
| Quarter | Primary Tasks | Difficulty |
|---|---|---|
| Q1 (Jan-Mar) | Visual inspection, winter debris removal, check for ice damage | Easy |
| Q2 (Apr-Jun) | Deep cleaning, pollen removal, inverter check, tilt adjustment | Moderate |
| Q3 (Jul-Sep) | Monitor temperature performance, check cooling clearances, light cleaning | Easy |
| Q4 (Oct-Dec) | Pre-winter cleaning, professional inspection, electrical connection review | Moderate |
Schedule your professional inspection in late fall, giving technicians time to address issues before winter weather limits access. This timing also ensures your system performs optimally during the shorter days when every percentage point of efficiency counts.
Set calendar reminders two weeks before each quarter starts. This advance notice lets you check weather forecasts and schedule around optimal conditions. Keep a simple log of each maintenance session, noting output levels before and after cleaning. Over time, this data reveals your system’s unique patterns and helps you refine the schedule to match your specific environment and performance needs.
Maintaining peak solar panel efficiency isn’t a one-time checkbox on your home improvement list. It’s an ongoing commitment that fits naturally alongside your other energy-conscious habits, from servicing your HVAC system to updating appliance settings seasonally.
The good news? The effort required is minimal compared to the returns. A quarterly visual inspection takes ten minutes. An annual cleaning might cost $150 or an afternoon of your time. Monitoring your production data becomes second nature after a few weeks. These small investments protect the tens of thousands of dollars you’ve already committed to your solar system.
Think of solar maintenance as preventive care rather than reactive repair. That mindset shift makes all the difference between panels that deliver their projected 25-year lifespan at optimal output versus systems that underperform from year five onward.
Your solar panels represent one of the smartest energy decisions you can make in 2026. They’ve already proven their value by reducing your utility bills and carbon footprint. Now it’s just about protecting that investment with the same attention you give to every other efficiency measure in your home. The panels will keep working hard for you, as long as you’re willing to work smart for them.