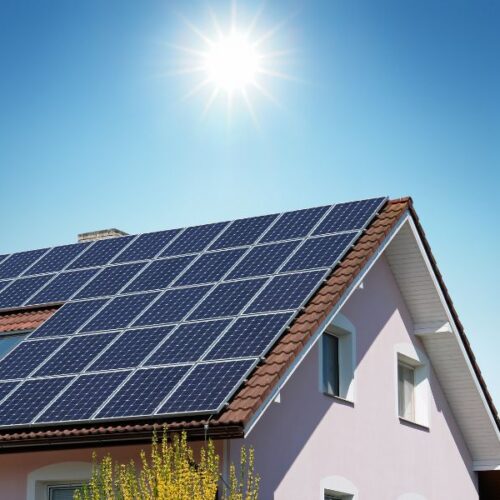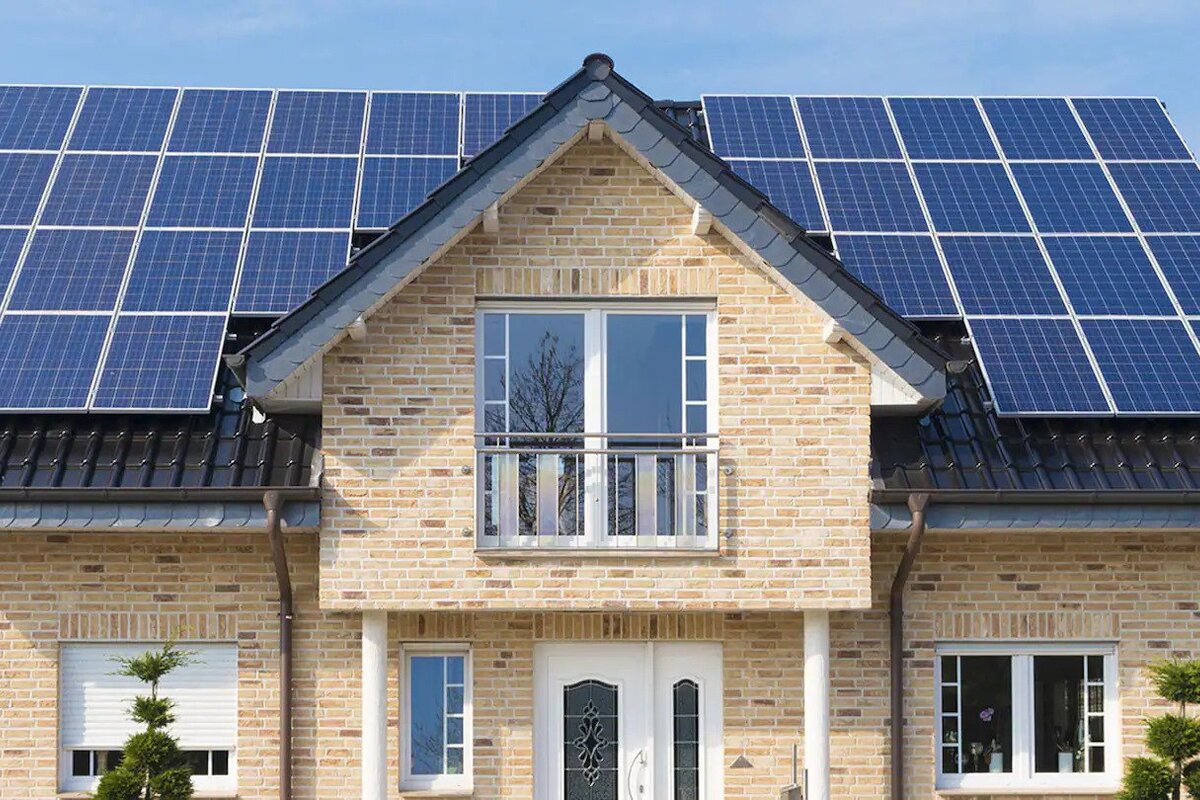

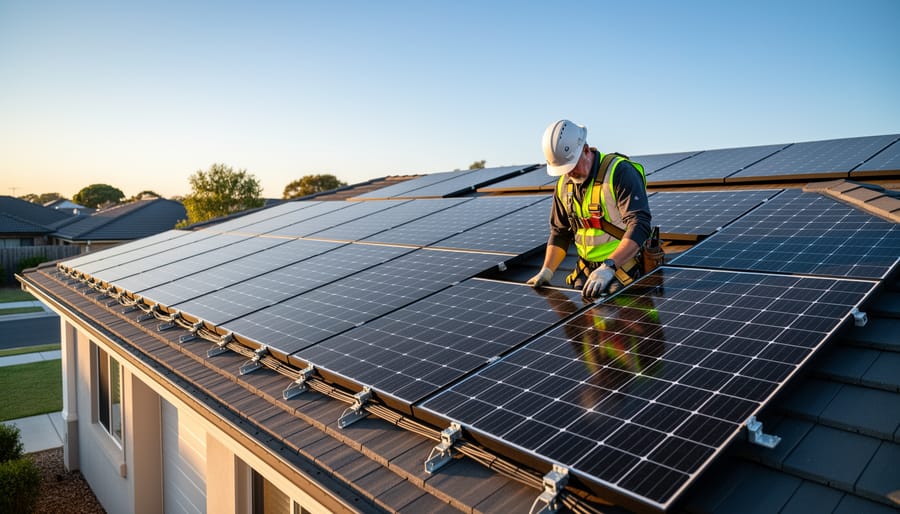
Expect to invest between $15,000 and $25,000 for a typical residential solar panel system in 2022, with the final price per watt averaging $2.77 nationally before incentives. This translates to roughly $11,000 to $18,000 after applying the 26% federal solar tax credit, though your actual costs will vary significantly based on system size, equipment quality, location, and installation complexity.
Calculate your specific investment by determining your household’s energy consumption in kilowatt-hours, then multiply your required system size by your region’s average cost per watt. A 6-kilowatt system in California runs approximately $16,620 before incentives, while the same installation in Florida costs around $15,540 due to regional market differences and labor rates.
Factor in additional expenses beyond equipment and installation, including permitting fees ($200-$1,000), electrical upgrades ($500-$2,000), monitoring systems ($300-$500), and potential roof repairs. These hidden costs can add 10-15% to your base estimate but are essential for accurate budgeting.
Investigate your state and local incentives immediately, as many programs operate on first-come, first-served funding or have application deadlines. States like New York offer additional rebates up to $5,000, while net metering policies in 38 states can reduce your payback period by 2-4 years through energy bill credits.
Understanding these concrete numbers empowers you to make informed decisions about solar adoption, compare installer quotes effectively, and project your return on investment with confidence rather than relying on vague industry estimates.
Average Solar Panel System Costs by Home Size
Understanding how home size affects solar installation costs helps homeowners budget accurately for their transition to clean energy. Based on 2022 installation data, the total investment varies significantly depending on your home’s square footage and corresponding energy consumption patterns.
The relationship between home size and solar costs isn’t perfectly linear, but clear patterns emerge when analyzing actual installations. Smaller homes typically require systems between 4-6 kilowatts, while larger properties often need 8-12 kilowatt arrays to offset their electricity usage effectively. According to NLR’s solar cost analysis, the national average installation cost in 2022 ranged from $2.75 to $3.50 per watt before incentives, depending on system size and location.
| Home Size (sq ft) | System Size (kW) | Cost Before Incentives | Cost After 26% Federal Tax Credit | Est. Monthly Savings |
|---|---|---|---|---|
| 1,000-1,500 | 4-5 kW | $12,000-$16,000 | $8,880-$11,840 | $80-$110 |
| 1,500-2,000 | 6-7 kW | $18,000-$22,000 | $13,320-$16,280 | $120-$160 |
| 2,000-2,500 | 8-9 kW | $24,000-$28,000 | $17,760-$20,720 | $160-$200 |
| 2,500-3,000+ | 10-12 kW | $30,000-$36,000 | $22,200-$26,640 | $200-$250 |
These figures represent comprehensive turnkey installations including panels, inverters, mounting hardware, permits, and professional labor. Regional variations can shift these numbers by 15-20 percent in either direction, with California and northeastern states typically commanding higher prices while southern and midwestern installations often cost less.
Energy consumption matters more than square footage alone when sizing your system. A 2,000-square-foot home with energy-efficient appliances and LED lighting might need only a 6-kilowatt system, while an identical-sized home with older HVAC equipment and electric heating could require 10 kilowatts or more. Solar installers typically analyze 12 months of utility bills to determine your actual needs rather than relying solely on home dimensions.
The economies of scale work in favor of larger installations. While doubling your system size doesn’t exactly double the cost, smaller systems often have proportionally higher per-watt costs due to fixed expenses like permits, site assessments, and connection fees being spread across fewer panels. This pricing structure makes comprehensive whole-home systems more cost-effective than undersized arrays that only partially offset energy consumption.
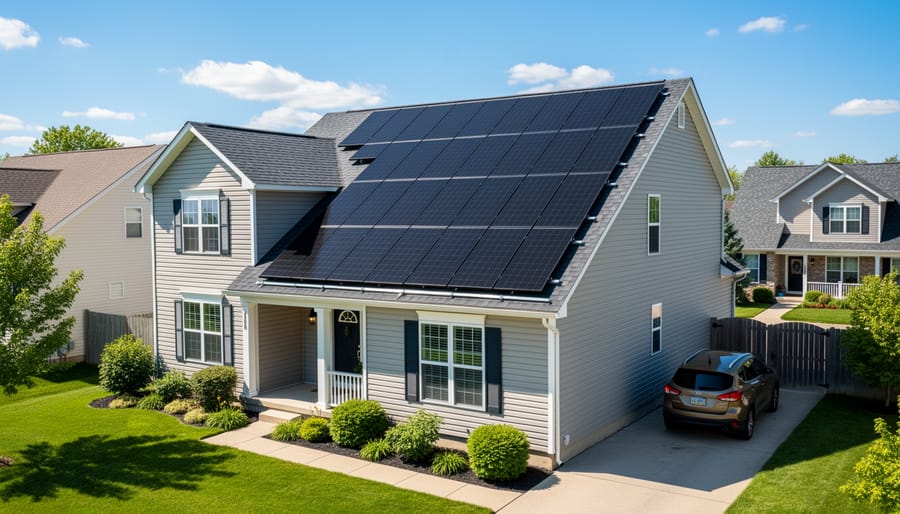
Cost Breakdown: What You’re Actually Paying For
Equipment Costs
Understanding equipment costs is essential for accurately budgeting your solar installation. The three primary components—solar panels, inverters, and mounting systems—each contribute significantly to your overall investment.
Solar panels represent the largest equipment expense, typically accounting for 25-30% of total system costs. The types of solar panels you select directly impact pricing. Monocrystalline panels, the premium option offering 18-22% efficiency, ranged from $0.90 to $1.50 per watt in 2022. Polycrystalline panels, a budget-friendly alternative with 15-17% efficiency, cost between $0.70 and $1.00 per watt. Thin-film panels, while less common for residential use, fell between $0.50 and $0.80 per watt. For a typical 6-kilowatt residential system, expect to invest $4,200 to $9,000 in panels alone.
Inverters, which convert DC electricity to usable AC power, add another $1,000 to $3,000 to your project. String inverters are the most economical choice at $1,000 to $1,500, while microinverters offer panel-level optimization for $2,000 to $3,000. Power optimizers provide a middle ground at $1,500 to $2,200. Exploring various inverter options helps you balance performance with budget.
Mounting systems, often overlooked in preliminary budgets, cost $500 to $1,500 depending on your roof type and installation complexity. Flush mounts for composition roofs are most affordable, while tile roof installations or ground-mount systems require specialized hardware and higher labor costs. According to solar industry expert Sarah Chen, “Many homeowners underestimate mounting costs, but choosing quality racking systems ensures panel longevity and optimal performance for decades.”

Installation and Soft Costs
While solar panels and inverters often grab the headlines, installation and soft costs represent a substantial portion of your total investment. Industry research indicates that soft costs comprise 65% of the total system price, making them impossible to ignore when budgeting for solar.
Labor costs typically range from $0.25 to $0.50 per watt, translating to $1,500 to $3,000 for an average residential system. This covers the skilled work of certified installers who mount racking systems, connect electrical components, and ensure your system meets safety standards. The complexity of your roof, accessibility challenges, and regional labor rates all influence this expense.
Permitting fees vary dramatically by jurisdiction, generally falling between $200 and $1,000. Your installer must navigate local building codes, obtain necessary approvals, and schedule inspections with municipal authorities. Some cities streamline this process with online systems, while others require multiple in-person submissions that increase administrative costs.
Interconnection fees cover the utility company’s expenses to connect your system to the grid, typically ranging from $75 to $500. This process involves engineering reviews, equipment upgrades to your meter, and documentation to enable net metering.
Additional soft costs include system design and engineering (often $250 to $500), sales and marketing overhead, and financing arrangement fees if you choose a loan or lease. Many installers also carry general liability and workers’ compensation insurance, costs that factor into your quoted price.
Understanding these expenses helps explain why the lowest equipment price doesn’t always mean the best deal. Experienced installers with efficient permitting processes often deliver better long-term value despite slightly higher upfront costs.
Regional Price Variations Across the United States
Your location plays a more significant role in solar panel costs than you might expect. The same 6-kilowatt residential solar system can vary by thousands of dollars depending on where you install it, with differences stemming from labor costs, permitting requirements, local competition, and state-specific incentives.
In 2022, California homeowners typically paid between $2.40 and $2.80 per watt for solar installations, translating to $14,400-$16,800 for a 6kW system before incentives. Meanwhile, Arizona residents enjoyed lower costs at $2.20-$2.60 per watt ($13,200-$15,600 total), thanks to abundant sunshine creating robust installer competition. Conversely, Northeast states like Massachusetts saw higher prices at $2.70-$3.20 per watt ($16,200-$19,200), driven by higher labor costs and more complex installation requirements due to roof architecture and snow load considerations.
| State/Region | Cost Per Watt | 6kW System Cost | Post-Incentive Cost |
|---|---|---|---|
| California | $2.40-$2.80 | $14,400-$16,800 | $10,656-$12,432 |
| Arizona | $2.20-$2.60 | $13,200-$15,600 | $9,768-$11,544 |
| Massachusetts | $2.70-$3.20 | $16,200-$19,200 | $11,988-$14,208 |
| Texas | $2.30-$2.75 | $13,800-$16,500 | $10,212-$12,210 |
The post-incentive costs shown above include the federal Investment Tax Credit but exclude state-specific programs that can further reduce expenses.
Several factors explain these regional disparities. States with established solar markets benefit from numerous competing installers, driving prices down through market dynamics. Local permitting complexity also matters significantly—some municipalities have streamlined approval processes, while others require extensive documentation and multiple inspections that increase installation time and labor costs. Additionally, regional wage differences for skilled electricians and installers directly impact your final bill. According to solar industry experts, installation labor represents 10-15% of total system costs, making regional wage variations particularly influential in final pricing.
Understanding your region’s typical pricing helps you identify fair quotes and avoid overpaying, ensuring you make informed decisions when comparing installer proposals.
Federal Tax Credits and State Incentives in 2022

How the Federal ITC Works
The federal tax credit, officially known as the Investment Tax Credit (ITC), can significantly reduce your solar panel costs. As of 2022, the ITC allows you to deduct 26% of your total solar installation costs from your federal taxes, making it one of the most valuable solar incentives available.
To claim this credit, you’ll need to meet several eligibility requirements. First, you must own your solar system outright—leased systems don’t qualify. The system must be installed at your primary or secondary residence in the United States, and you need sufficient tax liability to claim the full credit. The installation must be completed during the tax year you’re claiming.
Here’s how the process works: After your solar installation is complete, you’ll receive documentation from your installer showing the total system cost. When filing your federal tax return, complete IRS Form 5695 to calculate your credit amount. This form requires details about your installation costs, including equipment and labor. The credit then reduces your tax liability dollar-for-dollar.
Timing is crucial for maximizing your savings. The ITC is scheduled to step down to 22% in 2023 and decrease further in subsequent years. This means installing your system in 2022 provides the highest percentage return. If your tax liability is less than your credit amount, you can roll over the remaining credit to future tax years, ensuring you capture the full value of this substantial incentive.
Top State and Local Incentive Programs
Beyond the federal Investment Tax Credit, numerous states offer additional financial incentives that can dramatically reduce your solar panel investment. Understanding these programs is essential for calculating your true out-of-pocket costs in 2022.
Solar Renewable Energy Certificates (SRECs) represent one of the most lucrative opportunities in select markets. In states like Massachusetts, New Jersey, and Pennsylvania, homeowners earn SRECs for every megawatt-hour their system produces. These certificates can be sold on open markets, generating $200-$400 annually for an average residential system. Massachusetts homeowners, for instance, can earn approximately $3,000-$5,000 over a system’s first five years through the SMART program.
California’s Self-Generation Incentive Program (SGIP) offers substantial rebates for solar-plus-storage installations, providing up to $850 per kilowatt-hour of battery capacity. This program particularly benefits those in high fire-risk areas, where incentive rates increase significantly.
New York’s Megawatt Block Incentive Structure provides upfront state-level rebates ranging from $200 to $400 per kilowatt, depending on your utility territory and system size. A typical 6-kilowatt system could receive $1,200-$2,400 directly reducing installation costs.
Performance-based incentives in states like Rhode Island pay homeowners for actual energy production over time. Rhode Island’s Renewable Energy Growth Program offers fixed rates of approximately $0.35 per kilowatt-hour for 15 years, generating predictable long-term income.
Property tax exemptions and sales tax waivers in over 30 states further reduce effective costs. Texas, for example, exempts the added home value from solar installations from property tax assessments, saving homeowners hundreds annually.
Premium vs. Budget Solar Panels: Price and Performance
Understanding the differences between premium and budget solar panels can significantly impact your long-term savings and system performance. In 2022, the solar panel market offered distinct tiers, each with unique pricing structures and performance characteristics.
Budget-tier panels, typically manufactured by lesser-known brands or older production lines, ranged from $0.65 to $0.85 per watt in 2022. These panels generally delivered efficiency ratings between 15% and 17%, meaning they converted that percentage of sunlight into usable electricity. A standard 6-kilowatt system using budget panels cost approximately $3,900 to $5,100 before installation. These panels typically came with 10-year product warranties and 25-year performance warranties guaranteeing 80% output retention.
Mid-range panels from established manufacturers like Canadian Solar, Trina Solar, and Hanwha Q CELLS commanded prices between $0.85 and $1.10 per watt. With efficiency ratings of 18% to 20%, these panels required less roof space for equivalent power generation. The same 6-kilowatt system using mid-tier panels cost between $5,100 and $6,600 before installation. Product warranties extended to 12-15 years, with performance guarantees maintaining 85% output after 25 years.
Premium panels from industry leaders such as SunPower, LG, and Panasonic represented the top tier, priced from $1.10 to $1.50 per watt in 2022. These high-efficiency panels achieved ratings of 20% to 22.8%, with SunPower’s Maxeon series reaching the highest commercial efficiency levels. A 6-kilowatt premium system cost $6,600 to $9,000 before installation. Premium manufacturers offered 25-year product warranties alongside performance guarantees of 92% output retention.
According to solar installation expert Maria Rodriguez of SunTech Solutions, “The right panel tier depends on your specific situation. Homeowners with limited roof space benefit most from premium panels’ superior efficiency, while those with ample space can maximize value with budget or mid-range options.”
Budget panels make economic sense for large installations where roof space isn’t constrained, such as commercial buildings or properties with expansive roofs. They deliver acceptable performance at the lowest upfront cost, though degradation rates may slightly exceed premium alternatives.
Premium panels justify their higher cost in space-constrained situations, coastal environments requiring superior durability, or when maximizing long-term production matters more than initial investment. The enhanced warranties and slower degradation rates mean premium panels often produce more electricity over their lifetime, potentially offsetting the initial price premium through greater energy savings.
Mid-range panels strike an excellent balance for most residential installations, offering proven reliability, decent efficiency, and competitive pricing that optimizes the cost-performance equation for typical homeowners.
Financing Options and Their True Cost Impact
How you pay for your solar panels dramatically affects your long-term costs and savings. Understanding the true financial impact of different financing options helps you make the smartest investment decision for your situation.
Let’s examine three common approaches using a standard 8kW residential system with an initial equipment and installation cost of $24,000 before incentives.
| Financing Method | Upfront Cost | Monthly Payment | Total 25-Year Cost |
|---|---|---|---|
| Cash Purchase | $24,000 | $0 | $24,000 |
| Solar Loan (20 years, 5.99% APR) | $0 | $172 | $41,280 |
| Lease/PPA | $0 | $125 (escalates 2.9% annually) | $46,500 |
Cash purchases deliver the lowest total cost and fastest payback period, typically 6-8 years in most states. You immediately own the system, claim the full 30% federal tax credit (reducing your net cost to $16,800), and capture 100% of electricity savings. This option makes particular sense if you have available funds earning minimal returns elsewhere.
Solar loans eliminate upfront costs while preserving ownership benefits, including tax credits and renewable energy certificates. However, interest substantially increases total expenditure. A homeowner financing that same $24,000 system pays an additional $17,280 over 20 years. Despite higher costs, monthly loan payments often remain lower than previous electricity bills, creating immediate positive cash flow.
According to solar finance expert Maria Rodriguez from EnergySage, “Leases and power purchase agreements seem attractive with zero down, but customers typically pay 10-30% more over the system’s lifetime while sacrificing tax credits and other incentives to the leasing company.”
With leases and PPAs, you pay a fixed monthly fee or per-kilowatt-hour rate to use someone else’s equipment. Annual escalators compound costs significantly. While maintenance is included, you miss valuable ownership benefits and create complications if selling your home. The total cost often exceeds loan financing by $5,000-$15,000.
The right choice depends on your tax liability, available capital, and long-term plans. Cash buyers maximize savings, loan customers balance accessibility with ownership, while leases suit those prioritizing minimal responsibility over maximum return.
Hidden Costs and Surprise Expenses to Budget For
While initial solar panel quotes might seem comprehensive, homeowners frequently encounter additional expenses that can add 10-25% to the base installation cost. Understanding these potential charges upfront helps you budget accurately and avoid financial surprises.
Roof repairs or reinforcement represent one of the most common unexpected costs. If your roof is nearing the end of its lifespan or requires structural upgrades to support panel weight, you’ll need to address these issues before installation. This can add $5,000-$15,000 to your project, depending on the extent of work required. Many solar installers conduct roof assessments, but some homeowners only discover problems during the permitting process.
Electrical panel upgrades often catch homeowners off guard. Older homes with 100-amp electrical panels typically need upgrades to 200-amp systems to safely accommodate solar power. This upgrade ranges from $1,500-$3,000 and is required by most building codes. According to electrical contractor Mike Stevens, “About 40% of homes built before 1990 need panel upgrades, and this cost rarely appears in initial solar quotes.”
Tree removal or trimming becomes necessary when shade impacts panel efficiency. Professional tree services can cost $500-$2,000 per tree, depending on size and location. Solar companies perform shade analysis, but the removal costs aren’t always factored into financing calculations.
Permit fees and interconnection charges vary significantly by jurisdiction, ranging from $200-$1,500. Some utility companies also charge grid connection fees between $100-$800. Additionally, homeowners insurance premiums may increase by $50-$200 annually to cover the added property value and equipment.
Ground-mounted systems require trenching and additional materials, potentially adding $3,000-$8,000 compared to rooftop installations. These costs should be clearly outlined during consultation but warrant specific questioning if you’re considering this option.
Cost vs. Value: Calculating Your Return on Investment
Understanding whether solar panels make financial sense for your home requires moving beyond upfront costs to examine long-term value. The payback period—the time it takes for your energy savings to equal your initial investment—typically ranges from 6 to 12 years for most U.S. homeowners in 2022, though this varies significantly based on your location, energy consumption, and available incentives.
To calculate your ROI accurately, follow this systematic approach:
- Determine your current annual electricity costs by reviewing 12 months of utility bills and calculating your average monthly spending multiplied by 12.
- Calculate your system’s expected production by multiplying your array size by your area’s average sun hours and system efficiency (typically 75-85% after accounting for real-world conditions).
- Factor in all applicable incentives, including the 30% federal tax credit, state rebates, and local utility programs that reduce your net system cost.
- Calculate your payback period by dividing your net system cost (after incentives) by your annual electricity savings.
- Project your 25-year savings by multiplying annual savings by 25 years, accounting for 2-3% annual electricity rate increases while subtracting estimated maintenance costs.
According to solar industry analyst Jennifer Martinez from the Solar Energy Industries Association, homeowners should consider their break-even point alongside the total lifetime value. “A system with a 10-year payback period still generates 15 additional years of essentially free electricity, often totaling $20,000 to $40,000 in lifetime savings,” she explains.
Beyond pure financial returns, solar panels increase property values by an average of 4.1% according to Zillow research, adding approximately $9,200 to a median-valued home. For systems with payback periods under 10 years, expected returns on investment typically exceed 10% annually—outperforming many traditional investments while simultaneously reducing your carbon footprint and providing energy independence.
Understanding the estimated cost of solar panels in 2022 empowers you to make an informed investment in clean energy. With average residential system costs ranging from $15,000 to $25,000 before incentives, and the 26% federal Investment Tax Credit still available through year-end, now presents a particularly advantageous time to go solar. This tax credit will decrease to 22% in 2023, representing potential savings of $1,000 or more on a typical installation.
The key to maximizing your investment lies in thorough preparation. Request quotes from at least three certified installers to compare pricing, equipment quality, and warranties. Look for NABCEP-certified professionals who can provide detailed proposals outlining system specifications, projected energy production, and financing options. Don’t hesitate to ask about their experience with local permitting and utility interconnection processes.
Remember that the lowest price doesn’t always deliver the best value. Consider panel efficiency ratings, inverter technology, warranty terms, and installer reputation alongside cost. Many homeowners recoup their investment within 6-10 years through energy savings, making solar not just an environmental choice but a sound financial decision. Take advantage of 2022’s favorable incentive landscape and begin your solar journey today.